 Slope Fields: Answer to Example 1

Example: Consider the autonomous differential equation
 ,
,
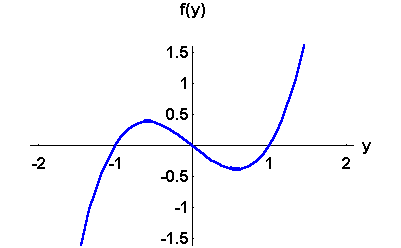
where the graph of f(y) is given by

- 1.
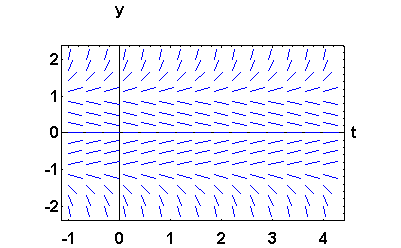
- Sketch the Slope Fields of this differential equation.
(Hint: the graph of the solutions and the graph of f(y) are two different entities.)
- 2.
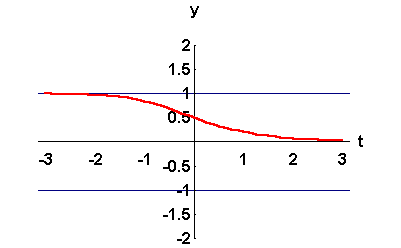
- Sketch the graph of the solution to the IVP

Find the limit  .
.
- 3.
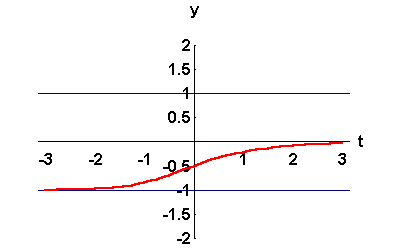
- Sketch the graph of the solution to the IVP

Find the limit  .
.
Answer:
- 1.
- Since we do not know the function f(y), we will
only be able to sketch the slope fields. This will give us an idea about the behavior of the solutions. Therefore, we should be looking for the critical solutions (given by the roots of f(y)=0), and the sign of f(y) which will give the variation of the solutions. Note that we should be careful not to mix between the graph of f(y) and the graphs of the solutions y(t).
So, according to the graph of f(y), the critical solutions are y= -1, y=0, and y=1. Using the sign of f(y), we conclude that
- the solutions located in the region y<-1 are decreasing,
- the solutions located in the region -1 < y<0 are increasing,
- the solutions located in the region 0<y<1 are decreasing,
- the solutions located in the region 1 < y are increasing.
The sketch of the slope fields is given below.

- 2.
- Using the slope fields, we sketch the graph of the solution satisfying the initial condition y(0) = 0.5.

Clearly, we have

- 3.
- Using the slope fields, we sketch the graph of the solution satisfying the initial condition y(0) = -0.5.

Clearly, we have


[Differential Equations]
[Slope Fields]
[Next Example]
[Geometry]
[Algebra]
[Trigonometry ]
[Calculus]
[Complex Variables]
[Matrix Algebra]
 S.O.S. MATHematics home page

Last Update 6-22-98
Copyright © 1999-2004 MathMedics, LLC. All rights reserved.
Math Medics, LLC. - P.O. Box 12395 - El Paso TX 79913 - USA
 Slope Fields: Answer to Example 1
  Slope Fields: Answer to Example 1
![]() ,
, 
![]()
![]() .
. ![]()
![]() .
. 

![]()

![]()

 S.O.S. MATHematics home page