 GRAPHS OF EXPONENTIAL AND LOGARITHMIC FUNCTIONS
 GRAPHS OF EXPONENTIAL AND LOGARITHMIC FUNCTIONS
GRAPHS OF EXPONENTIAL FUNCTIONS
By Nancy Marcus
In this section we will illustrate, interpret, and discuss the graphs of exponential and logarithmic functions. We will also illustrate how you can use graphs to HELP you solve exponential and logarithmic problems and check your solutions.
Reminder: Remember that when we talk about the function, the function value, the value of the function, y or f(x), we are talking about the value and behavior of the y part of the point (x, y) in the full set of the points that form the graph..
Exponential Graphs:
Once you know the shape of an exponential graph , you can shift it vertically or horizontally, stretch it, shrink it, reflect it, check answers with it, and most important interpret the graph.
Example 1:
The function
![]() is always positive. There is simply no value of
x that will cause the value of
is always positive. There is simply no value of
x that will cause the value of
![]() to be negative. What does this
mean in terms of a graph? It means that the entire graph of
the function
to be negative. What does this
mean in terms of a graph? It means that the entire graph of
the function
![]() is located in quadrants I and II.
is located in quadrants I and II.
Graph the function
![]() . Notice that the graph never crosses the
x-axis. Why is that so? It is because there is no value of
x that will cause the value of f(x) in the formula
. Notice that the graph never crosses the
x-axis. Why is that so? It is because there is no value of
x that will cause the value of f(x) in the formula
![]() to equal
0.
to equal
0.
Notice that the graph crosses the y-axis at 1. Why is that so?
The value of x is always zero on the y-axis. Substitute 0 for
x in the equation
![]() :
:
![]() . This translates to the point (0, 1).
. This translates to the point (0, 1).
Notice on the graph that, as the value of x increases, the value of f(x) also increases. This means that the function is an increasing function. Recall that an increasing function is a one-to-one-function, and a one-to-one function has a unique inverse.
The inverse of an exponential function is a logarithmic function and the inverse of a logarithmic function is an exponential function.
Notice also on the graph that as x gets larger and larger, the function value of f(x) is increasing more and more dramatically. This is why the function is called an exponential function.

|
If you are interested in reviewing the graphs of exponential functions, examples and problems, click on Exponential.
Logarithmic Graphs:
Once you know the shape of a logarithmic graph , you can shift it vertically or horizontally, stretch it, shrink it, reflect it, check answers with it, and most important interpret the graph.
Example 2:
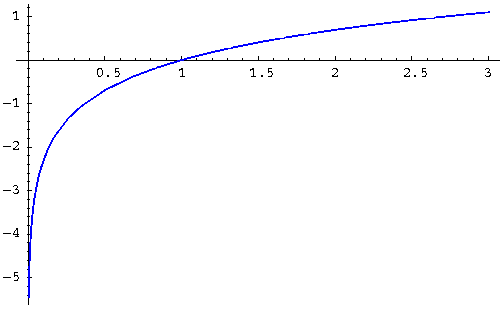
Graph the function
![]() . Notice that the graph of this function
is located entirely in quadrants I and IV. Notice also that
the graph never touches the y-axis.
. Notice that the graph of this function
is located entirely in quadrants I and IV. Notice also that
the graph never touches the y-axis.
What does that mean? It means that the value of x (domain of
the function f(x) in the equation
![]() is always positive. Why is
this so? Recall that the equation
is always positive. Why is
this so? Recall that the equation
![]() can be rewritten as the exponential
function
can be rewritten as the exponential
function
![]() . There is no value of f(x) that can cause the value
of x to be negative or zero.
. There is no value of f(x) that can cause the value
of x to be negative or zero.
The graph of
![]() will never cross the y-axis because x can never
equal 0. The graph will always cross the x-axis at 1.
will never cross the y-axis because x can never
equal 0. The graph will always cross the x-axis at 1.
Notice on the graph that, as x increases, the f(x) also increases. This means that the function is an increasing function. Recall that an increasing function is a one-to-one-function, and a one-to-one function has a unique inverse.
Notice on the graph that the increase in the value of the function is most dramatic between 0 and 1. After x = 1, as x gets larger and larger, the increasing function values begin to slow down (the increase get smaller and smaller as x gets larger and larger).
Notice on the graph that the function values are positive for x's that are greater than 1 and negative for x's less than 1.

|
If you are interested in reviewing the graphs of logarithmic functions, click on Logarithmic.

 S.O.S MATHematics home page